Tangible Map
Home
How does Data become a Story?
Addressing the terrabytes of data generated through our environment will require interfaces that appeal to more of our senses than just sight. By combining tactile textures and representation of a data field, we created an experience that is more concrete to a user while allowing the signals to create a story. We want to explore what interactions allow us to best interact with physical and digital information.

A Campus Full of Info
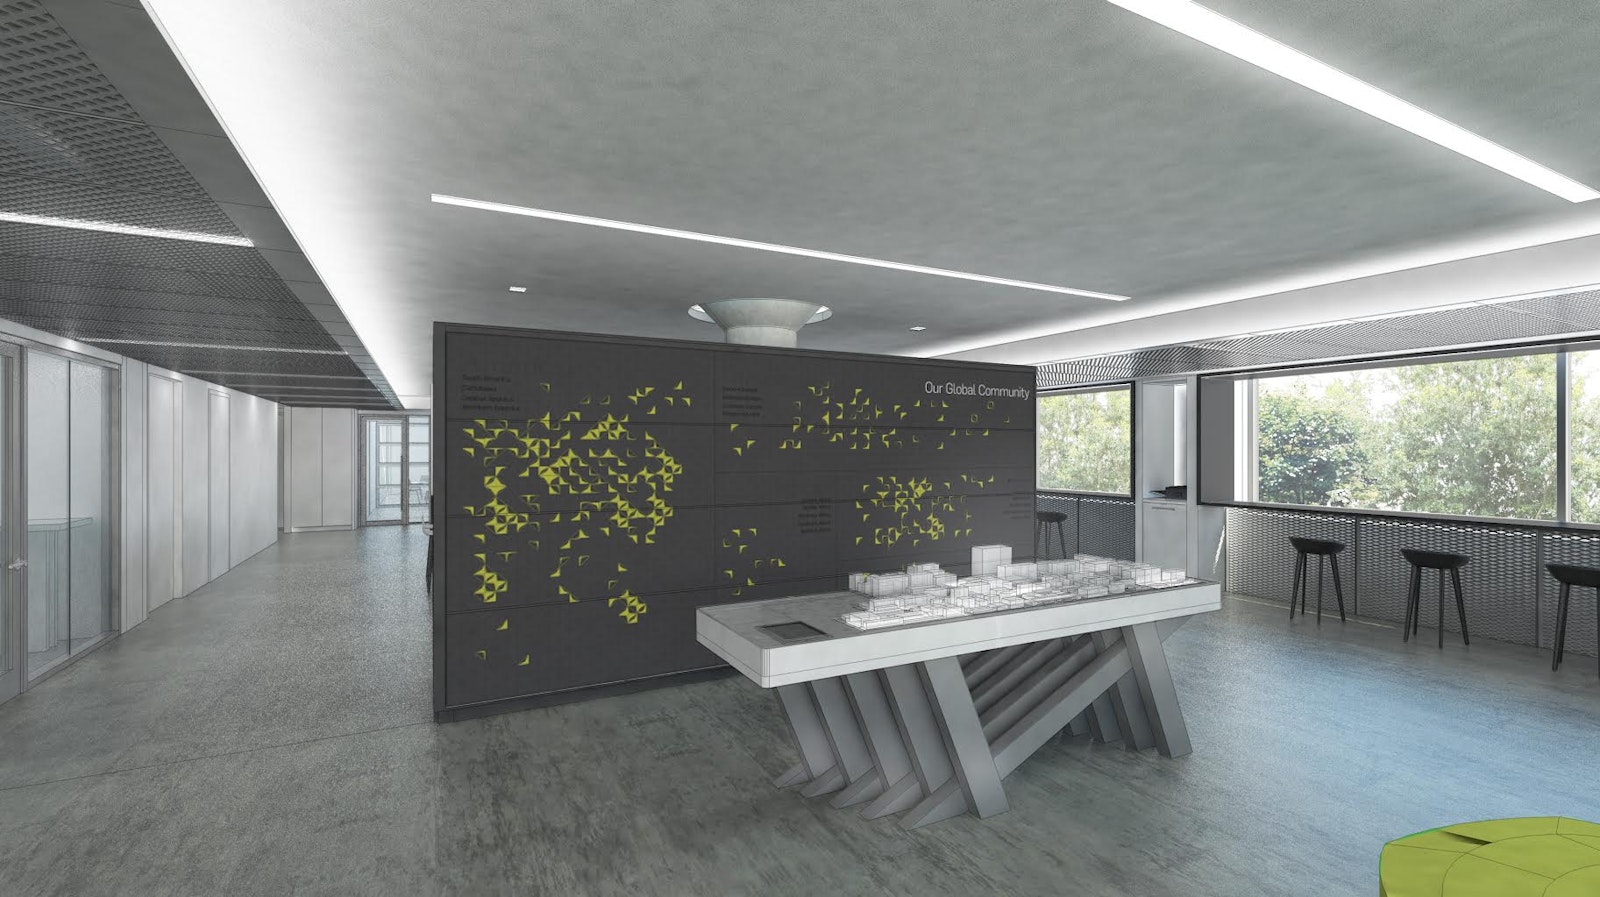
We developed the Tangible Map as a response to a large, data-intensive community, specifically the MIT campus. Many aspects of the campus have digital records available through an API, such as professors, buildings, and courses. Further information, such as live Wi-Fi connections or building energy usage, allow us to express concepts through the flow of light and color.

Making it Real
Connecting the data to a range of human senses, we embodied the campus through a grouping of water-clear, scaled 3D printed buildings. In response to user interactions and cues, the buildings are choreographed to light up or animate to illustrate endpoints, events, or data visualizations. By connecting these digital versions with modern interfaces, such as search and touch, we create a simple, rapid way to navigate through a myriad array of data. Through the simple act of touch, we hope to transform the flow of data into a narrative more akin to a dance.
Visit Our Map
The Tangible Map is currently installed at part of the MIT ATLAS welcome center, in Cambridge, Massachusetts. Visitors to the campus are welcome to interact with the map. If you visit, send us a tweet and let us know what you thought of the experience.
As a living research project, development of the Map continues at the Design Lab exploring new features and continuing our exploration of interfaces.